


Midterm Elections Are Shaping Up as a Worst-Case Scenario for Stocks Under President Donald Trump, but Perspective Is Important
Midterm Elections Are Shaping Up as a Worst-Case Scenario for Stocks Under President Donald Trump, but Perspective Is Important

Sean Williams, The Motley FoolSun, September 20, 2026 at 8:26 AM UTC
1

A split Congress may spell trouble for the stock market under President Trump. Image source: Official White House Photo.Key Points -
Midterm elections on Nov. 3 may prove pivotal to the Dow Jones Industrial Average, S&P 500, and Nasdaq Composite.
Nearly a century of history shows that a Republican president and a divided Congress generate the weakest average annual stock market returns.
However, perspective is everything when investing on Wall Street.
10 stocks we like better than S&P 500 Index ›
In 44 days, on Nov. 3, Americans across the country will make their voices heard by heading to the polls or mailing in their ballots.
Midterm elections also have plenty of bearing on Wall Street's leading indexes, the Dow Jones Industrial Average(DJINDICES:^DJI), S&P 500(SNPINDEX:^GSPC), and Nasdaq Composite(NASDAQINDEX:^IXIC). While not all policies enacted on Capitol Hill are relevant to Wall Street, the fiscal policy developed in Congress does impact corporate America and, therefore, the stock market.
Missed AI’s "Act 1"? Act 2 Could Be 15x Bigger. Most investors think they missed the AI boat because they didn't buy Nvidia in 2005. But according to our analysts, we’re only at the end of "Act 1"—the R&D phase. "Act 2" is the global rollout. Continue »
Based on prediction markets, the 2026 midterm elections are shaping up as a worst-case scenario for stocks under President Donald Trump. But if investors take a step back and examine the bigger picture, they'll realize even less-than-ideal scenarios offer a silver lining.
The puzzle pieces are falling into place for subpar stock market returns
Heading into Nov. 3, Republicans control both houses of Congress -- 53 of 100 seats in the Senate and 218 of 435 seats in the House of Representatives -- and the White House.
Unified governments are favorable for facilitating the passage of major legislation. During President Trump's six years in the White House, Republicans have controlled the House and Senate in the first half of both terms. Perhaps unsurprisingly, Trump signed major tax and spending bills into law both times.
In December 2017, Donald Trump signed the Tax Cuts and Jobs Act (TCJA) into law, permanently lowering the peak marginal corporate income tax rate from 35% to 21% (its lowest level since 1939). On July 4, 2025, he signed the "Big, Beautiful Bill" into law, making the personal tax bracket cuts from the TCJA permanent and introducing several temporary tax breaks.
But according to traders on Polymarket, there's a 53% probability of Democrats sweeping both houses of Congress on Nov. 3. Prediction market traders also assign a 32% chance to Republicans retaining the Senate and Democrats taking back the House. By comparison, traders predict just a 13% chance that the GOP holds its slim congressional majority in both houses.
Historically, based on annualized returns for the benchmark S&P 500, a Republican president with a divided Congress (whether it's the opposing party controlling one or both houses) is the least-favorable scenario for investors.
Retirement education platform Retirement Researcher calculated the average annual return of the S&P 500 from 1926 to 2023 based on whether a Democrat or Republican president occupied the White House, and whether they had a unified or divided Congress. Over this nearly century-long period, there was only one dubious outlier:
Democratic president with a divided Congress: 16.63% average annual return over 15 years
Unified Republican: 14.52% average annual return over 13 years
Unified Democrat: 14.01% average annual return over 36 years
Republican president with a divided Congress: 7.33% average annual return over 34 years
While it's impossible to say for certain why a split Congress under a Republican president underperforms so notably, political gridlock is likely part of the answer. It's highly unlikely that President Trump will be able to push through any major legislation during the latter half of his second term if Democrats take control of either house of Congress.
Furthermore, a split Congress makes debt-ceiling negotiations dicier. Although the stock market didn't plunge during previous government shutdowns over the debt ceiling, a divided Congress raises concerns about the ability and willingness of opposing parties to work together.
From a historical and statistical perspective, Wall Street's worst-case scenario appears to be playing out under President Trump.

Image source: Getty Images.Perspective is everything when investing on Wall Street
While nearly a century of average annual return data suggests it could be rough sledding for the Dow Jones Industrial Average, S&P 500, and Nasdaq Composite in the coming years, investors' perspectives can change everything.
Advertisement
For example, even though the projected 2026 midterm elections scenario (Republican president with a divided Congress) has significantly underperformed other arrangements since 1926, a 7.33% average annual return still blows the annualized returns of other asset classes out of the water. Compared to Treasury bonds, housing, and several commodities, owning stocks, even in this less-than-ideal scenario, has been the preferred choice in hindsight.
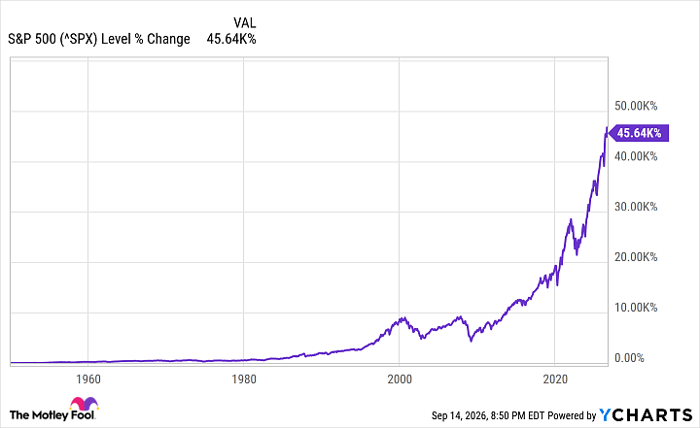
Additionally, the resiliency of the stock market, even amid worrisome scenarios, can't be ignored.
^SPX data by YCharts
Every year, the analysts at Crestmont Research update a data set that calculates the rolling 20-year total returns, including dividends, of the broad-based S&P 500 since 1900. Even though the S&P wasn't officially incepted until 1923, researchers tracked and calculated the total return of its components in other major indexes back to the turn of the century.
Crestmont's data set yielded 107 rolling 20-year periods since 1900 (1900-1919, 1901-1920, and so on, through 2006-2025). What's remarkable is that all 107 generated a positive annualized total return. Put simply, no matter what was thrown the stock market's way, be it a depression, recession, pandemic, high inflation, wars, or political uncertainty, the S&P 500 was higher, including dividends, every time after 20 years.
Could a split Congress make things challenging for the Dow Jones Industrial Average, S&P 500, and Nasdaq Composite over the final two years of Donald Trump's presidency? Absolutely.
But will this worst-case scenario prevent long-term-minded investors from building wealth? History conclusively says no.
Should you buy stock in S&P 500 Index right now?
Before you buy stock in S&P 500 Index, consider this:
The Motley Fool Stock Advisor analyst team just identified what they believe are the 10 best stocks for investors to buy now… and S&P 500 Index wasn’t one of them. The 10 stocks that made the cut could produce monster returns in the coming years.
Consider when Netflix made this list on December 17, 2004... if you invested $1,000 at the time of our recommendation, you’d have $387,158!* Or when Nvidia made this list on April 15, 2005... if you invested $1,000 at the time of our recommendation, you’d have $1,365,749!*
Now, it’s worth noting Stock Advisor’s total average return is 932% — a market-crushing outperformance compared to 211% for the S&P 500. Don't miss the latest top 10 list, available with Stock Advisor, and join an investing community built by individual investors for individual investors.
See the 10 stocks »
*Stock Advisor returns as of September 20, 2026.
Sean Williams has no position in any of the stocks mentioned. The Motley Fool has no position in any of the stocks mentioned. The Motley Fool has a disclosure policy.
Source: “AOL Money”
